
Running a speed test sounds simple — open a website, click a button, see a number. But for rural internet users, interpreting speed test results correctly and using them effectively requires considerably more nuance. A single speed test number tells you almost nothing useful. A properly conducted series of tests at strategic times, combined with an understanding of what the numbers actually measure and what they mean for your specific use cases, gives you actionable intelligence about your connection’s true performance. This comprehensive guide covers everything a rural internet user needs to know about testing, interpreting, and using speed test data to improve their connectivity in 2026.
In This Guide
- What Speed Tests Actually Measure
- The Four Key Metrics Explained
- Best Speed Test Tools for Rural Users
- How to Test Correctly: The Rural Protocol
- When to Test: Building a Performance Profile
- What Your Numbers Mean for Real-World Use
- Speed Testing Starlink Specifically
- Using Results to Diagnose Problems
- Documenting Speed Tests for FCC Challenges
- Frequently Asked Questions
What Speed Tests Actually Measure
A speed test measures the performance of your internet connection between your device and a test server at a specific moment in time. It is a snapshot, not a comprehensive assessment. Understanding what this snapshot does and does not capture is essential for interpreting results correctly:
What a speed test DOES measure:
- The maximum data transfer rate your connection can sustain to a specific server at the moment of the test
- The round-trip time for small data packets between your device and the test server (latency/ping)
- The consistency of your upload and download speeds during the test window (jitter)
What a speed test DOES NOT measure:
- Your connection’s typical performance at different times of day
- Performance between your home and the specific servers used by Netflix, Zoom, or your employer’s VPN — which may differ significantly from the nearest speed test server
- The quality of your connection for real-time applications (a test can show 50 Mbps but still have packet loss that destroys video calls)
- Your ISP’s actual network capacity — some ISPs prioritize speed test traffic to make results appear better than everyday performance
With these limitations in mind, speed tests are still highly useful — especially for rural users who need to document their actual connection performance for FCC broadband map challenges, ISP complaints, or evaluating whether an upgrade is necessary.
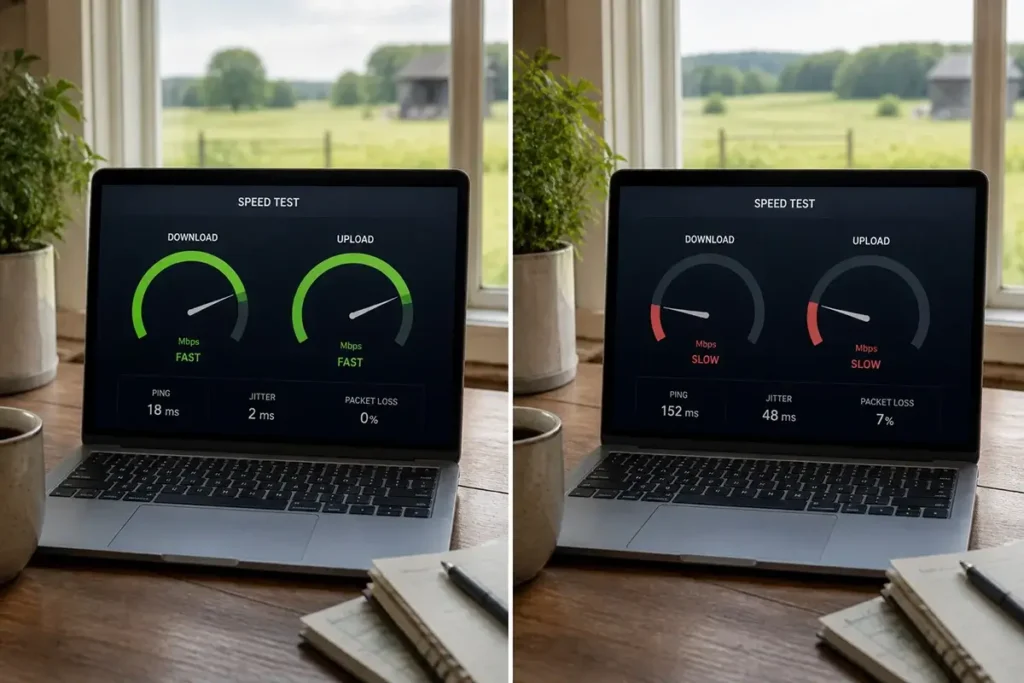
The Four Key Metrics Explained
1. Download Speed (Mbps)
Download speed measures how quickly data transfers from the internet to your device. This affects how fast web pages load, how smoothly video streams, and how quickly large files download. For rural households, download speed is the metric most prominently advertised by ISPs and is the number most people focus on — though it is not always the most important metric for their actual use cases.
In 2026, the FCC defines broadband as 100 Mbps download or higher. For practical rural household use, the minimum threshold for comfortable multi-device use is approximately 25 Mbps. Below 10 Mbps, multiple simultaneous users begin experiencing significant degradation.
2. Upload Speed (Mbps)
Upload speed measures how quickly data transfers from your device to the internet. This is the metric that determines video call quality, cloud file sync speed, remote desktop responsiveness, and how fast you can send large email attachments. Rural users consistently underestimate the importance of upload speed until they try to make a video call and realize their outgoing video is choppy for the other person even when download speeds seem fine.
Most rural internet services have asymmetric connections — download is significantly faster than upload. Starlink Standard delivers 8–18 Mbps upload; HughesNet delivers 2–3 Mbps upload. For video calls, the minimum upload requirement is 3–5 Mbps per active call session.
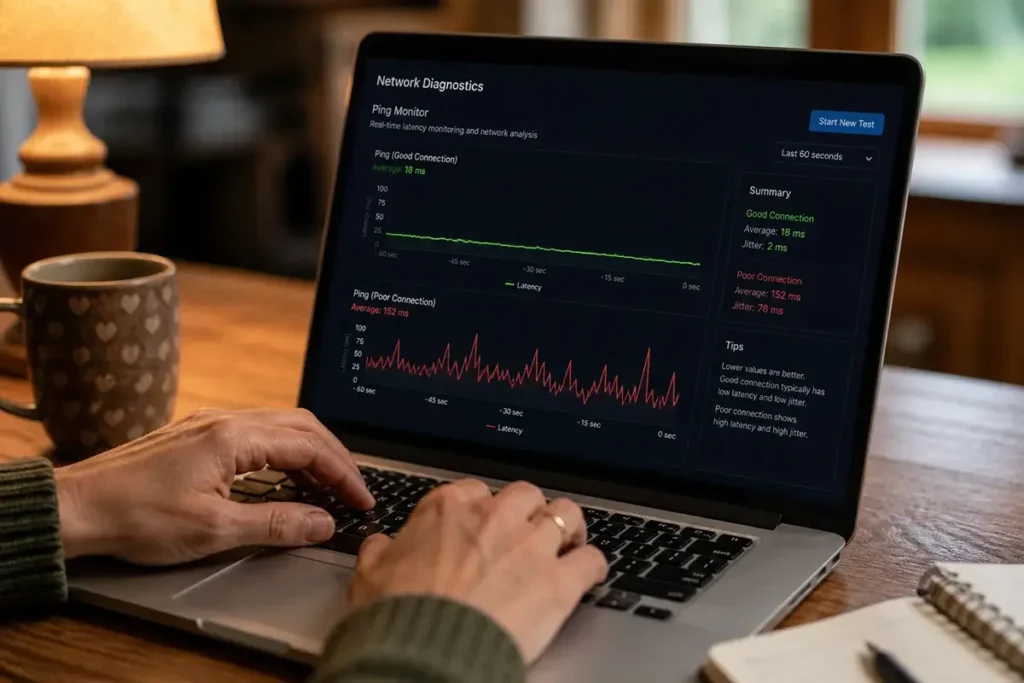
3. Latency / Ping (milliseconds)
Latency is the round-trip time for a small data packet to travel from your device to the test server and back, measured in milliseconds (ms). This is the single most important metric for real-time applications — video calls, gaming, VoIP phone calls, and interactive web applications. Low latency (under 50 ms) makes the internet feel responsive and natural. High latency (600+ ms on geostationary satellite) makes real-time applications feel like a difficult international phone call from the 1990s.
Latency thresholds for rural internet use cases:
- Under 20 ms — Excellent, fiber/cable quality
- 20–60 ms — Very good, Starlink typical range, all applications work well
- 60–150 ms — Acceptable, video calls work with minor delay
- 150–300 ms — Poor, video calls feel noticeably laggy
- Over 500 ms — Unacceptable for real-time applications, geostationary satellite range
4. Jitter (milliseconds)
Jitter measures the variation in latency — how consistently your ping time stays at its average value. Low jitter means your latency is consistent (e.g., always 35–38 ms). High jitter means your latency varies widely (e.g., sometimes 30 ms, sometimes 150 ms, sometimes 80 ms). High jitter is particularly damaging to voice and video call quality because it creates the choppy, pixelated, “breaking up” audio and video that makes calls feel unreliable even when average latency seems acceptable.
For rural internet connections, jitter under 10 ms is excellent. Jitter of 10–30 ms is acceptable for most applications. Jitter above 50 ms will cause noticeable degradation in video and voice call quality regardless of average latency.
Best Speed Test Tools for Rural Users in 2026
| Tool | URL | Best For | Key Feature |
|---|---|---|---|
| Speedtest.net (Ookla) | speedtest.net | General purpose, FCC documentation | Widest server network, most widely recognized |
| Fast.com | fast.com | Netflix streaming performance | Uses Netflix CDN servers — tests real streaming path |
| Cloudflare Speed Test | speed.cloudflare.com | Latency and jitter analysis | Shows jitter, loaded latency, upload/download |
| Waveform Speed Test | waveform.com/tools/bufferbloat | Video call quality assessment | Tests bufferbloat — critical for video call reliability |
| MLab Speed Test | speed.measurementlab.net | FCC-approved documentation | Powers FCC’s official speed measurement; accepted in challenges |
| Starlink Speed Test (in app) | Starlink app | Starlink-specific diagnostics | Tests between dish and Starlink’s own network — shows dish-specific performance |
For most purposes, Speedtest.net by Ookla is the recommended starting point — it has the widest server selection, the most recognition in ISP support conversations, and its results are accepted as documentation in FCC broadband map challenges. Run Speedtest.net first, then Cloudflare Speed Test for latency and jitter detail, and Waveform for bufferbloat if video calls are your primary concern.
How to Test Correctly: The Rural User Protocol
A single speed test taken casually on a busy family network tells you almost nothing useful. Follow this protocol for meaningful rural speed test data:
- Use a wired connection. Connect your laptop or computer directly to your router via Ethernet cable. Wi-Fi adds variability that obscures your actual internet connection performance. Test the internet connection, not the Wi-Fi.
- Disconnect all other devices from the network. Or at minimum, ensure no other devices are actively downloading, streaming, or syncing during your test. Background cloud sync, smart TV updates, and other devices can significantly skew results.
- Close all applications on the test device that might use internet bandwidth (browsers, email, cloud sync).
- Choose the nearest server in Speedtest.net for your first test — this gives the most favorable result. Then deliberately choose a server in a city that represents your actual usage (if you video call clients in Chicago, test with a Chicago server).
- Run three consecutive tests and note all three results. Take the middle result as your reference point — the highest and lowest are likely outliers.
- Record all results including the specific server used, time of day, date, and test tool. This documentation is essential if you need to challenge FCC coverage claims or file an ISP complaint.
When to Test: Building a Rural Performance Profile
For rural internet users, the time of day dramatically affects test results. Building a performance profile across different time periods gives you a realistic picture of your connection’s actual capabilities:
Early morning (5–8 AM): Typically your fastest results. Network congestion is minimal, priority data thresholds are freshest, and satellite cells are least loaded. Early morning results represent your connection’s maximum potential.
Midday (11 AM – 1 PM): Moderate load. Results here indicate your connection’s typical daytime performance during working hours — important for remote workers.
Peak evening (7–10 PM): Your slowest results. Network congestion is highest. This is the performance you get when trying to watch Netflix or game online in the evening — your real-world entertainment and family internet experience.
Run tests at all three windows for five consecutive days and record the results. The pattern this reveals tells you far more than any single test: if early morning tests show 120 Mbps but peak evening tests show 15 Mbps, you have significant peak-hour congestion. If all time periods show similar mediocre results, the problem is structural (weak signal, equipment limitation) rather than congestion-based.
Speed Testing Starlink Specifically
Starlink has specific testing considerations that differ from cable or DSL connections. The Starlink app provides its own built-in speed test that measures performance between your dish and Starlink’s network backbone — this is useful for diagnosing whether performance issues are on the Starlink side or in your local network. The app also shows:
- Obstruction percentage: What percentage of the satellite path has been blocked by obstacles over the monitoring period. Any obstruction above 5% will affect performance.
- Signal quality: A composite score indicating overall dish-to-satellite link quality.
- Downtime: Total minutes of service interruption in the current period — useful for quantifying weather-related or obstruction-related outages.
- Data usage: Total downloaded and uploaded data for the billing period — essential for managing the 1 TB priority data threshold on Standard plans.
When Starlink’s in-app speed test shows good results but external speed tests (Speedtest.net) show poor results, the problem is usually in your local network between the router and your device — Wi-Fi congestion, router placement, or a device-specific issue. When both the in-app test and external tests show poor results simultaneously, the issue is on Starlink’s network side — peak-hour congestion, satellite handoff issues, or coverage cell overload.
Documenting Speed Tests for FCC Broadband Map Challenges
If you are filing an FCC broadband map coverage challenge — to correct an ISP’s overclaimed coverage at your address — speed test results are among the most powerful forms of evidence you can submit. For maximum effectiveness:
- Use the MLab Speed Test (speed.measurementlab.net) — it is directly integrated with the FCC’s broadband measurement infrastructure and carries the highest evidentiary weight in formal challenges
- Run at least five tests across multiple days at different times of day and keep screenshots of each result including the timestamp
- Document the specific service you are testing — if you are challenging a DSL provider’s claimed speed, test on that DSL connection, not your Starlink backup
- Include a brief written statement explaining that your address is listed as receiving service at [claimed speed] but your repeated tests demonstrate actual delivered speed of [your measured average]
The FCC’s broadband challenge documentation specifies exactly which evidence types are accepted for speed challenges — review this before compiling your challenge submission to ensure your documentation meets the requirements.
Frequently Asked Questions
Why does my speed test show 100 Mbps but Netflix still buffers?
Speed tests measure the fastest possible connection to a nearby test server under ideal conditions. Netflix streams from its own CDN servers, which may have a different routing path than your test server. Additionally, Netflix and other streaming services use adaptive bitrate streaming that reacts to consistent available bandwidth over time — not the peak speed your connection can briefly achieve. Run a test at fast.com instead of Speedtest.net, since fast.com uses Netflix’s actual CDN servers and gives a more relevant measurement for streaming performance.
My Starlink speed test shows 80 Mbps download but my Zoom calls are still choppy. Why?
Video call quality depends more on upload speed, latency, and jitter than on download speed. Check your upload speed specifically — if it is below 3 Mbps, your outgoing video will be choppy for other call participants regardless of download speed. Also test jitter using Cloudflare Speed Test or Waveform — jitter above 30–50 ms causes choppy audio and video even with adequate bandwidth. If you’re on Wi-Fi, test with a wired Ethernet connection to eliminate Wi-Fi variability as a factor.
How do I know if my rural ISP is throttling my connection?
Test at multiple times of day and compare results. If early morning speeds are consistently 3–5x faster than peak evening speeds, peak-hour deprioritization is occurring — this is normal behavior documented in all rural ISP terms of service, not technically throttling. True throttling (reducing speeds below contracted levels regardless of time) would show consistently low speeds at all hours. Document your results and compare against your plan’s advertised speeds — if consistently delivered speeds are significantly below the advertised rate even at off-peak hours, you may have grounds for an ISP complaint or FCC challenge.


Leave a Reply